An oscilloscope is a vital tool in electronics, telecommunications, physics, and many other fields. An oscilloscope is mainly used to visually display and waveform analysis of electronic signals. The oscilloscope is the most common instrument for electronic engineers, often referred to as the "eyes" of engineers, highlighting its importance.
Oscilloscope used for for waveform analysis:
But how are signals displayed on the oscilloscope screen? The signal transmission on the oscilloscope involves passing through a series of resistors and capacitors inside the probe. Then, the signal enters the oscilloscope and goes through the analog input signal conditioning module. Depending on the signal's magnitude, it is appropriately amplified or attenuated to fit within the dynamic range of the analog-to-digital converter (ADC). The analog signal is converted into digital data (1s and 0s) within the ADC module. Meanwhile, the trigger module compares the signal with specified trigger conditions. These trigger conditions instruct the time-base module on when to capture digital data and store it in the circular acquisition memory. The digital signal processing module (DSP) analyzes the digital data and reconstructs the waveform, which is then displayed on the screen.

For all oscilloscopes, once the signal is displayed on the screen, the next step is to perform the corresponding measurements. Oscilloscopes nowadays come with rich built-in measurement capabilities, allowing engineers to quickly analyze the amplitude and timing parameters of waveforms.
Some examples of these basic measurements of Waveform Analysis include:
Let us see in detail how to read an oscilloscope?
-
Rise Time: Rise time is the time taken for the signal to transition between specified lower and upper threshold levels. It is measured by subtracting the time at the lower threshold of the edge being measured from the time at the upper threshold.
- Fall Time: Fall time is similar, except it is measured by subtracting the time at the upper threshold of the edge being measured from the time at the lower threshold.

- Pulse Width: Pulse width is the time duration from the midpoint of the first rising edge to the midpoint of the next falling edge.

- Amplitude and Other Voltage Measurements: These involve measuring the magnitude of waveform display. Typically, you can measure parameters such as peak-to-peak voltage, maximum voltage, minimum voltage, and average voltage.

- Period/Frequency: The period is defined as the time between two consecutive crossings of a voltage threshold. Frequency is defined as 1/period.

- Setup and Hold Time: Setup time is the minimum time required for data to be stable before the clock edge arrives. Hold time is the minimum time required for data to remain stable after the clock-triggering event occurs.

- Eye Diagram: Simply put, an eye diagram is formed by overlaying a series of received pulse signals (000, 001, 010, 011, 100, 101, 110, 111) at the receiver on a high-speed oscilloscope. By adding an eye diagram template, one can quickly assess whether the signal meets bus or system requirements.
There are many other measurements for which oscilloscope used for , such as duty cycle, offset, noise, jitter, and so on. These are just some basic measurement concepts.
Traditionally, oscilloscope measurements are in the time domain, but with technological advancements, oscilloscopes have become more diverse.
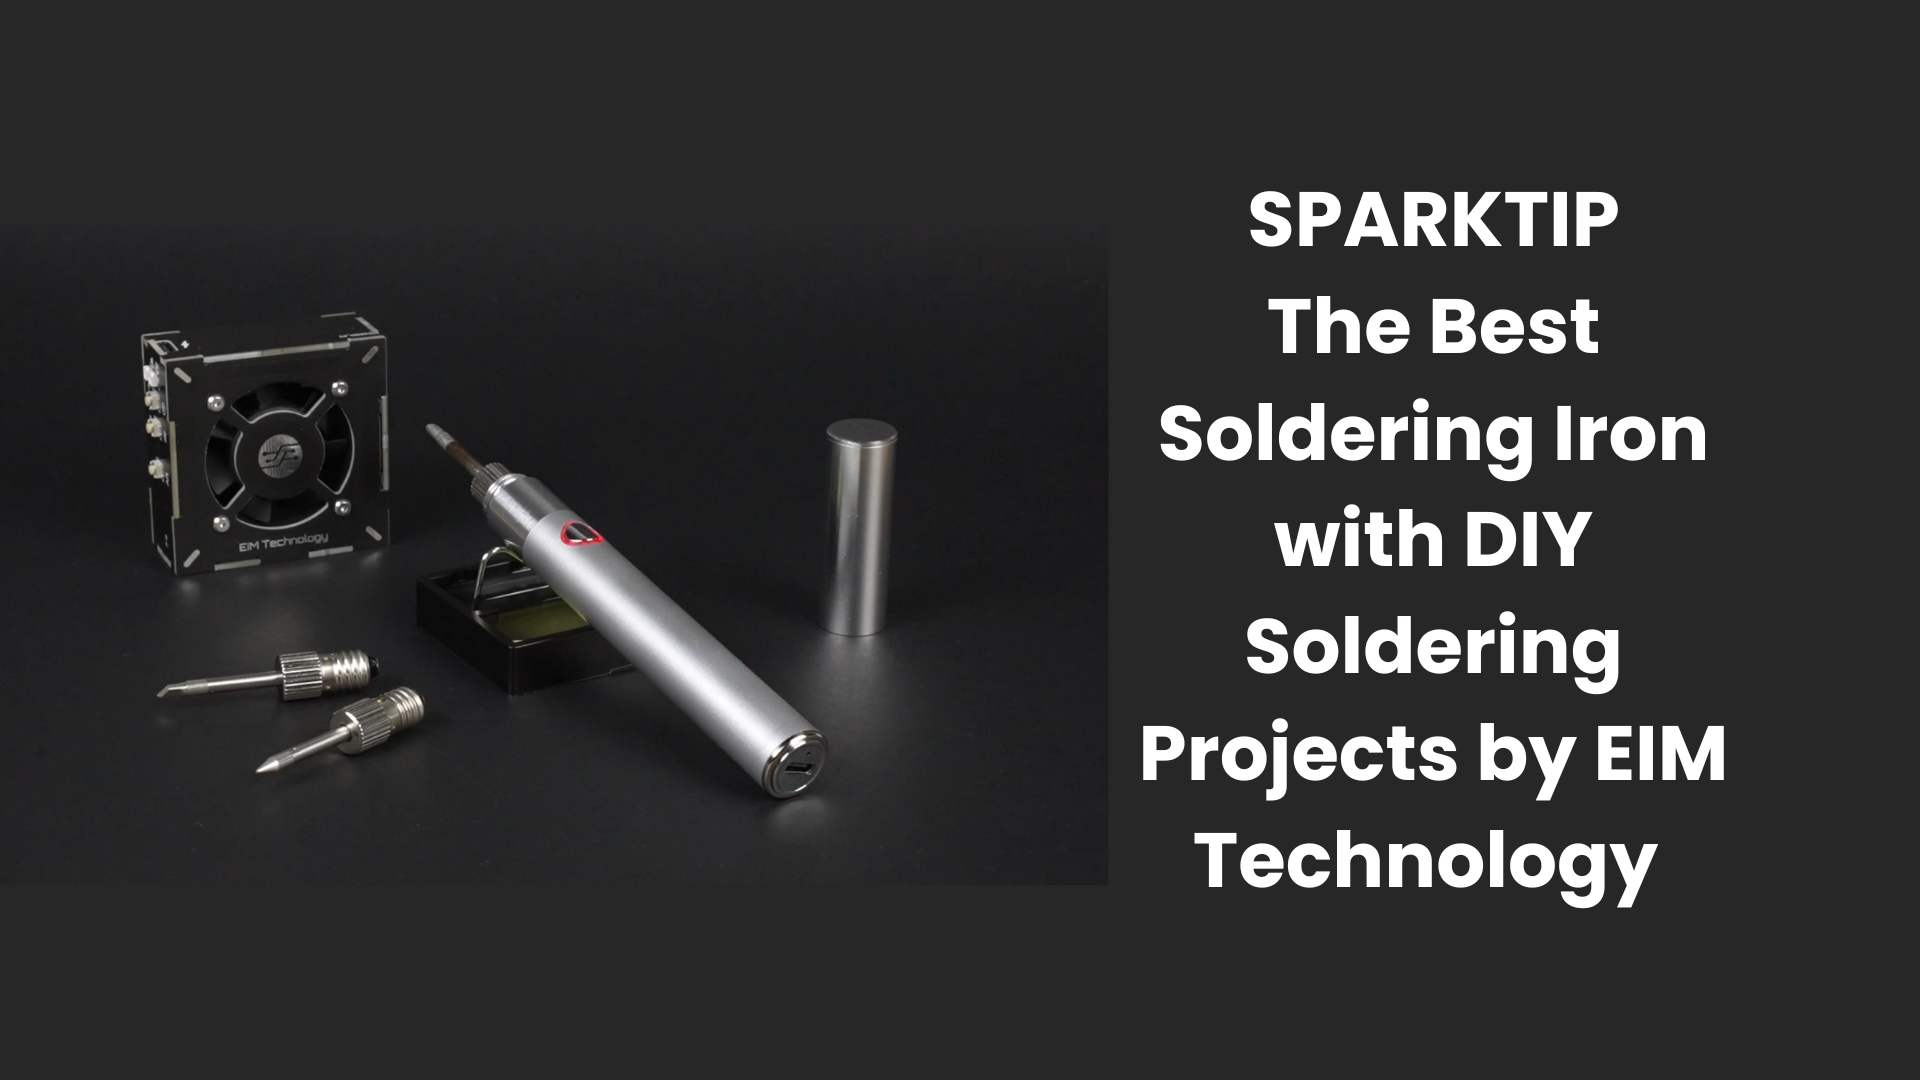
EIM Technology brings a modern suitable USB Portable Oscilloscope, Zoolark which an Oscilloscope with function generator which can be easily converted to a Digital Oscilloscope using its software Zookee. It allows you connect Zoolark to computer for better visual performance. You can export oscilloscope screen capture and .csv file for further data processing.
Some highlights of Zoolark are:
- Oscilloscope Function Generator, Zoolark is a perfect Oscilloscope with function generator. Multipurpose Debugging Tool: The ZOOLARK debugger tool is incredibly versatile and features a 5 in 1 design, with working modes for DC Reference, Spectrum, PWM Signal, Function Generation and Oscilloscope, fulfilling various functions.
- Compact and Portable: Unlike similar products on the market, this frequency generator has a sleek, compact and modern design, with reduced lightweight dimensions, fitting in your backpack, laptop case or pocket.
- User-Friendly Interface: Featuring a classic on/off button, with convenient menu selection modes, type C USB port and a superior quality display, this function generator is easy to use, suitable for applied science, engineering students or electronics hobbyists.

Some oscilloscopes can also measure parameters in the frequency domain, especially in power integrity and EMC analysis, where signals in the time domain are often converted into frequency domain curves for analysis. Observing which frequency range has issues can help pinpoint and solve problems effectively.